Quick Tour
SurveyShare provides comprehensive tools to create surveys, distribute them, & analyze the results. Click on a section to learn more:
Step 1: Create Your Survey
Create your survey your way. Creating a survey should not be a time-consuming or painful process. We have created a powerful survey editor where you can add, edit, delete, and rearrange questions simply and efficiently.
There are 20 different question types you can use to create professional looking and powerful surveys. Our possible question types include multiple choice, rating scales, open answer, date and/or time, demographics, and more. You can also optionally add an "other" response, randomize answer choice to eliminate bias, and require answers to questions.
If you would like to get a jump start on survey creation, we have 200+ templates to help you start your survey. You may use them as is, or modify them to suit your needs.

Step 2: Customize Your Survey Settings

There are several ways to customize your survey.
First, you may customize the look and feel of your survey. We have over 40 pre-defined themes and 60 background images to customize the look and feel of your survey. If you don't like any of the pre-defined themes, feel free to create one of your own.
You also control many options about how your particpant experiences your survey. Change how the questions are numbered or edit the text that is displayed when a question is not answered. Change the text that a participant views at the start or closing of the survey. Or instead of closing statement, you may share the public results with your participants.
The security of your survey is also important to us. Set a password for the survey, or restrict the participant list to list of e-mails that you provide. You are also free to set a cut-off date when responses will no longer be accepted.
There are many possibilites. How you customize your survey is up to you.

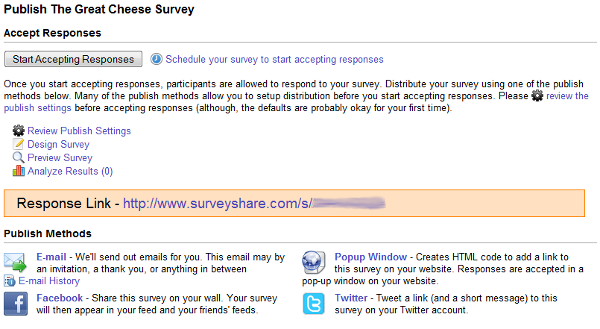
Step 3: Publish & Collect Results
When you are ready to start collecting responses, head to the publish section and click "Start Accepting Responses". You may stop collecting responses at any time or schedule a time to stop collecting responses. It's all up to you.
Each survey you create has a unique link associated with it. You are always free to send this link to anyone. Copy and paste it into an email. Write it in a letter. Put it anywhere you think people may find it.
However, we also integrate with
![]() Facebook
and
Facebook
and
![]() Twitter. With a few clicks, you can
automatically post your survey to your Facebook account or your Twitter accounts
to collect responses. For Facebook, the survey will appear on your wall and
your feed. For Twitter, we'll put the link to the survey in your post where
you may add your own comments (up to 140 characters, of course).
Twitter. With a few clicks, you can
automatically post your survey to your Facebook account or your Twitter accounts
to collect responses. For Facebook, the survey will appear on your wall and
your feed. For Twitter, we'll put the link to the survey in your post where
you may add your own comments (up to 140 characters, of course).
Have your own website? We provide the HTML to add to your webpage so people may respond to the survey directly from your website. Responses are collected in a pop-up window on your website. The people who participate never leave your website.
Step 4: Get Real-Time Results

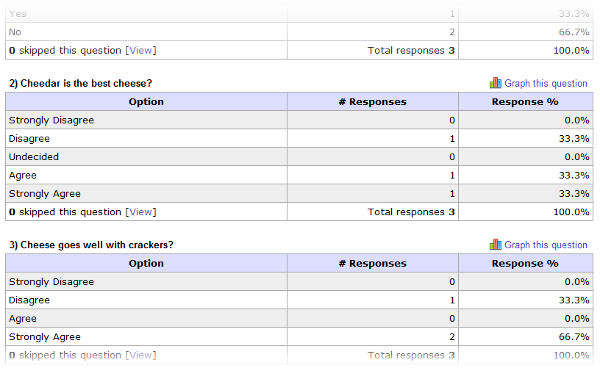
As we collect results, you may analyze them! Results are presented in two ways. You may either view them as an aggregate or individually.
Aggregate results show you what your responses look like collectively. We compile the results for you and display the aggregate data. For example, 83% answered yes, and 17% answered no. Of course, some questions - like open answer questions - cannot be aggregated, so we simply display the percent of people who did and did not response. To get at responses for open response type questions you may view your responses individually.
Individual results show you how each participant answered. Responses are consistent across questions, so the same response 5 in question #1 is the same response 5 in question #7. The individual results show you exactly what a participant responded to any given question.
You can also create graphs. For any question that we can aggregate, you may also create a bar charts, pie charts, and line graphs. To the right is an example pie chart. There are many options to customize the graphs ranging from color, size, and what data to display.
Any Pro account you may download your data into Excel, SPSS, or any other program that is compatible with CSV (comma separated value) format. With Excel or SPSS you can provide any amount of statistical analysis and manipulation.
Below is quick peak at some of the results for our Great Cheese Survey. When you're ready, try surveyshare for free!